TP-Link TD-W9970 “Error code:1 Internal error” – Solved

When trying to change WiFi settings on my TP-Link TD-W9970 v4 I got “Error code:1 Internal error” (and one button saying “OK”; it is not OK!). The TP-Link forms indicate I am not the first, but the TP-Link support people haven’t given any useful advice. Taking a backup of settings, resetting, and restoring the settings DID NOT fix things… just a waste of time.

Eventually, I stumbled upon the solution: I enabled the “Guest Network”.

Then I could change WiFi settings, especially the way the default “auto” settings are for a 40MHz bandwidth on an auto-selected WiFi channel (which is not helpful for managing multiple access points and a Zigbee network). The Guest Network can be turned off again afterwards.

Hooray!

Updating EmonPi to Continuous Monitoring

Continuous monitoring with the Open Energy Monitor EmonPi hardare us now possible (since Feb 2023), see: https://docs.openenergymonitor.org/emonpi/firmware.html. This gives a more accurate measurement of power than sampling at time intervals.

Unfortunately, the process is incompletely documented there and the forum contains several threads which contain errors, distractions, and diversions alongside the information to make the firmware update work. I certainly had to spend time disentangling things to arrive at what is actually a simple procedure, although the forum was a source of some trepidation. Also: do not be tempted into the compilation process described on that firmware web page.

NB: what follows is based on my EmonPi setup. I believe some details will be different for EmonTX + EmonBase setup.

First, ensure that your system is up to date using Setup > Admin > Update: Full Update. This does not change the firmware, but will change what you see available in the Update Firmware Only section. Once updated, you can select options in the drop-down lists in the Update Firmware Only. My hardware is an emonPi and I opted for the “RFM68 LowPowerLabs” radio format (as recommended). Upon hitting the “Update Firmware” button, various messages will appear in the log.

Once it has completed, you will see that there are no updates in Setup > Inputs or Setup > EmonHub. This is because the baud rate and message format have changed. In Setup > EmonHub, use the “Edit config” button to fix this. Changes to two sections are required.

Under “[interfacers]” will be an entry which seems to have gone under different names at different times and/or different hardware configurations. If you have an emonPi, look for the section which contains “com_baud = 38400”, “pubchannels = ToEmonCMS”, and “baseid = 5”. Mine is identified as [[RFM2Pi]]. If you do not have an emonPi then a different baseid will apply. I only changed the com_baud from 38400 to 115200. Leave the rest alone!

Scroll down and find, under “[nodes]”, a section “[[5]]” (matches the baseid above). Leave the “nodename” entry as it is but modify the lines under “[[[rx]]]” to read:

names = Msg, power1,power2,power1pluspower2,vrms,t1,t2,t3,t4,t5,t6,pulse1count,pulse2count,E1,E2
datacodes = L, h, h, h, h, h, h, h, h, h, h, L, L, l, l
scales = 1, 1,1,1, 0.01, 0.01,0.01,0.01,0.01,0.01,0.01, 1, 1, 1,1
units = n,W,W,W, V, C,C,C,C,C,C, p, p, Wh,Wh

Note that the scales line can be used to adjust the power values and Vrms which the emonPi records to accomodate systematic errors due to component tolerances; the text quoted above assumes that this calibration has not been done.

I found that simply saving the config and then using the “View log” button showed this worked. Some people state that EmonHub should be restarted, but I did not find this was needed.

Make a final check that things are working by visiting Setup > Inputs and looking at graphs, visualisation, your app etc. At this point, you might note that there are now two new attributes in the input data: E1 and E2. Unfortunately (again, argh!), the meaning of these (vs the pre-existing power1 and power2) is not properly documented and mentions in the forums are often roundly uninformative.

Castleton Mining History Field Guide

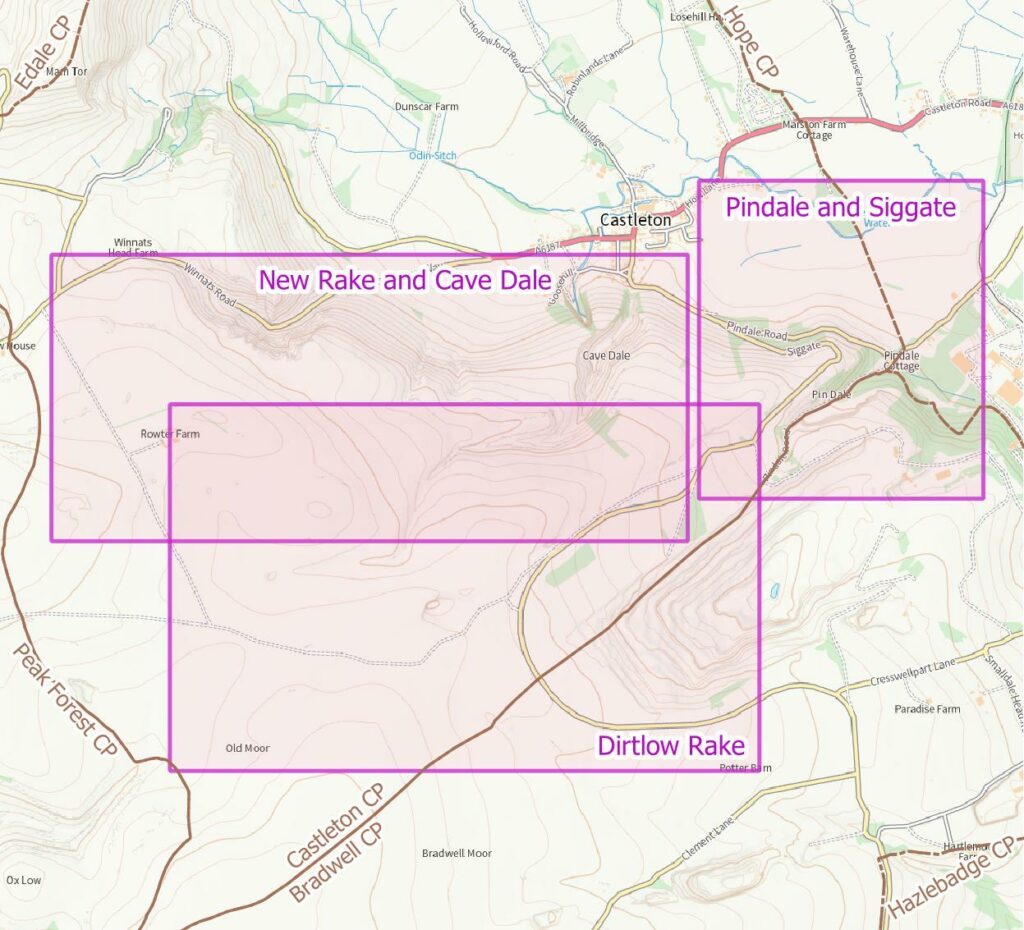
This field guide contains three itineraries around mining history sites (and some geology and other historical notes) near to Castleton in the Peak District: New Rake and Cave Dale, Pindale and Siggate, and Dirtlow Rake.

The main download is a zip file which contains a written field guide, maps, and digital location data for GPS devices.


If you make use this guide, please let me know by adding a comment. You can also post corrections and suggestions (but please note I am unlikely to respond to requests for more information).

Links to all mining history field guides may be found on the Peak District Mining History Field Guides index page.

Getting to Grips with the HLK-LD015 Human Presence (Radar) Sensor

The HLK-LD015 is a 5GHz radar-based device to detect the presence of human beings, and similar moving objects, produced by Hi-Link. The documentation is a little sparse, especially with regards to the UART configuration procedure/commands (not even the baud rate is given!), but the device is ridiculously inexpensive. I paid £1.40 + tax and shipping from an AliExpress seller and the Hi-Link website price is just $1.65. After some sleuthing, I discovered that the “dist_radar_setting_tool” under Downloads on the LD010 prduct page will work with the LD015, although it isn’t clear whether this covers all the options. To use this, you will need something like a USB-Serial converter (I used by old FT232 breakout). Note that the board requires the use of 5V supply and logic. Remember to connect the sensor TX to the converter RX, and vice versa.

I suspect these are made for automatic light control as there is a photodiode and the output is a single I/O pin, and there is no UART output, unlike some of the higher end sensors.

The photodiode is supposed to suppress sensing if there is over threshold light, but the documention is not clear about whether this is enabled, and mentions enablement in software while not explaining that (I am still uninformed on this topic).

The setting tool is branded as “Airtouch” and the chip on the LD015 bears the Airtouch logo and the part number “5810S 2038DA”. Referring to the Airtouch website, this seems likely to be the AT5810 chip. Unfortunately, there is no useful data there.

Observations Using the “Radar Setting Tool”

The setting tool is a fairly thin wrapper around sending UART style serial messages to the sensor. See below for my decoding of the serial message structure.

The baud rate is 9600.

The pertinent settings for practical device use are:

  • “Distance”, although this seems not to be a distance measure at all; “threshold” might be better. A value of 0 gives the most sensitive performance, with switching occurring up to around 6m distance. Increasing the value quickly decreases sensitivity and by 6, you have to be right close! Oddly, values of 255 seem fairly sensitive, while the drop-down list has values 0-15. There is no documentation on what the values mean, or the valid range, but a “write” followed by a “read” returns the same value.
  • “LightOnTime” controls the duration (seconds) the OUT pin remains high after detection.
  • “Lux THR” appears to have no effect and a write followed by a read DOES NOT return the written value (a 0 is always returned).
  • It is also possible to enable/disable the radar, and to manually turn the OUT pin on and off. These might be useful for a practical micro-controller + sensor set-up.

Settings appear not to be saved across power-down.

Testing sensitivity was not quite as easy as initially expected, with the triggering distances often seeming to change for the same distance setting. I suspect this is due to the algorithm used to avoid false detection, and it SEEMed to be the case that the sensitivity was a little better just after a bit of fairly close approach (within 2m), lasting a little while and then tailing off. The device will trigger both walking towards and away from the sensor, but it is strictly a movement sensor.

Sniffing the Serial Messages

I used a Picoscope with UART decoding to capture and decode the signals sent by the setting tool and returned by the device.

In the following, the messages are all shown as hexadecimal.

The messages are framed as: {2 bytes of preamble} + {1 byte giving length} + {message} + {1 byte checksum}.

The preamble for messages to the sensor is 555A, while that from the sensor is 55A5.

The length is of the message + the checksum.

The checksum is computed by summing all the bytes [preceeding it] and using the least significant byte (i.e. sum taken modulo 256).

The message is composed of 1 command byte and from 0 to two data bytes. Double-byte data is sent least-significant byte first.

The “light on” (OUT pin high) and off command is 0A, and a single byte of 00 or 01 turns the output off or on, respectively. e.g. 55 5A 03 0A 01 BD turns the output on.

The radar on/off command is D1, and the pattern is the same. e.g. 55 5A 03 D1 00 83 turns the radar off.

The command bytes for “distance”, “light on time”, and “lux thr” vary according to whether a read or write is being undertaken. Distance has one data byte, while the others have two bytes of data.

  • Read distance command is 03 and write distance command is 02
  • Read light on time command is 05 and write is 04
  • Read and write lux thr commands are 07 and 06, respectively

Example: read light on time requires a send of 55 5A 02 05 B6 (note length = 2 this time) and leads to a reply of 55 A5 04 05 2C 01 30 (note length = 4 bytes and that the data is 012C hex = 300 decimal).

General Conclusions

This would make for quite a usable sensor for use with a 5V system such as the “traditional” Arduinos. The range is rather limited and the simple on/off output rather limiting, but for a smaller room or located close to a doorway, this would work well.

Using Websockets with EmonPi MQTT Broker to Create a “Live Feed” Dashboard

This is not a complete description of the background tech; there is plenty of info on the web about websockets, mqtt, and the javascript libraries.

The motivating idea behind this experiment is to be able to have a live-updating dashboard with the minimum set of dependencies of the “install X” kind. Since the EmonPi aleady has a MQTT broker, it provides the basis for feeding data to the dashboard. Websockets allows a “web page” (it can be a file viewed in your web browser) to send and receive data, and update the page, using JavaScript. This is not particularly difficult, but there are several steps which took a couple of evenings to research and put into practice, so here are some notes (for myself in the future, and anyone else who finds it!).

If you are looking for some “homework reading”, a decent place to start is Steve’s Internet Guide.

Make Mosquitto Listen for Websockets Connections

Mosquitto is the MQTT broker on the EmonPi. It is configured to listen for connections which employ the “mqtt:” protocol. It is possible to add a websockets listener (“ws:” protocol), with the conventional port 9001 assignment as follows:

  • SSH onto the EmonPi and navigate to /etc/mosquitto.
  • Modify the mosquitto.conf file to add “listener 9001” and “protocol websockets”, see below. I have also added explicit lines for the default mqtt listener on port 1883 in the interest of clarity, although I believe they are not required. You will need to use “sudo”. Alternatively, it should be possible to add a file to the “include_dir”.
  • Restart mosquitto using “sudo systemctl restart mosquitto.service”
pid_file /var/run/mosquitto.pid
persistence false
persistence_location /var/lib/mosquitto/
log_dest file /var/log/mosquitto/mosquitto.log
include_dir /etc/mosquitto/conf.d

listener 1883
protocol mqtt

listener 9001
protocol websockets

allow_anonymous false
password_file /etc/mosquitto/passwd
log_type error

It should now be possible to test two things: that the existing mqtt protocol listener, which is relied on to service data to EmonCMS, and that the websockets listener us “up”. I used “MQTT Explorer”, a free and simple client, which should be set up to not validate a certificate and to have an empty “Basepath” (it defaults to “ws”).

Create the Websockets Dashboard with HTML and JavaScript

My primary aim for this experiment is to be able to co-opt EmonPi to broker air quality data from a home-brew particulate matter, VOC, NOx, CO2 sensor combo, but I’m using the existing emon data to demonstrate the concept, which boils down to “guages” using the Google Charts toolkit, and scrolling line charts using Chart.js.

Here is the code to hack about with, based on snippets from various places, with modifications and updating to a recent. It should just live in a plain text file with a “.html” extension, and can be opened in your web browser. It is not beautiful but demonstrates the concept. There is some logging to the “console”, which is where error messages will also appear. Hit F12 on Firefox or Edge (or Chrome too I think) to find the console.

<!DOCTYPE html>
<html lang="en">
<head>
    <meta charset="UTF-8">
    <!-- This helps with viewing on mobile devices -->
    <meta name="viewport" content="width=device-width, initial-scale=1, shrink-to-fit=no">
    <title>Real-Time Charts</title>
    <!-- Google charts -->
    <script type="text/javascript" src="https://www.gstatic.com/charts/loader.js"></script>
    <!-- Chart.js -->
    <script src="https://cdnjs.cloudflare.com/ajax/libs/Chart.js/3.9.1/chart.min.js" integrity="sha512-ElRFoEQdI5Ht6kZvyzXhYG9NqjtkmlkfYk0wr6wHxU9JEHakS7UJZNeml5ALk+8IKlU6jDgMabC3vkumRokgJA==" crossorigin="anonymous" referrerpolicy="no-referrer"></script>
    <!-- The Paho Javascript for MQTT over Websockets -->
    <script src="https://cdnjs.cloudflare.com/ajax/libs/paho-mqtt/1.0.1/mqttws31.min.js" type="text/javascript"></script>
    <!-- Bootstrap CSS - can be removed but will help with the styling -->
    <link rel="stylesheet" href="https://cdnjs.cloudflare.com/ajax/libs/bootstrap/5.2.3/css/bootstrap.min.css" integrity="sha512-SbiR/eusphKoMVVXysTKG/7VseWii+Y3FdHrt0EpKgpToZeemhqHeZeLWLhJutz/2ut2Vw1uQEj2MbRF+TVBUA==" crossorigin="anonymous" referrerpolicy="no-referrer" />
    <link rel="stylesheet" type="text/css" href="{{ url_for('static', filename='main.css') }}">
</head>
<body>
<script type="text/javascript">
    // load the google charts stuff and only after it is loaded should we start to set up the data acquisition
    // otherwise, we find the charts library is being called upon before it exists!
    google.charts.load('current', {'packages':['gauge']});
    google.charts.setOnLoadCallback(doWhenReady);

    function doWhenReady() {
        // Create a client instance. NB clientid SHOULD BE DIFFERENT between browser clients; the following should work fine in a home environment.
        var clientId = "client-" + Date.now().toString();
        client = new Paho.MQTT.Client("192.168.1.1", 9001, clientId);
        // set callback handlers
        client.onConnectionLost = onConnectionLost;
        client.onMessageArrived = onMessageArrived;
        // connect the client
        client.connect({onSuccess:onConnect, userName: "emonpi", password: "emonpimqtt2016"});

        // called when the client connects
        function onConnect() {
          // Once a connection has been made, make subscriptions
          console.log("onConnect");
          client.subscribe("emon/emonpi/vrms");
          client.subscribe("emon/emonpi/power1");
        }

        // called when the client loses its connection
        function onConnectionLost(responseObject) {
          if (responseObject.errorCode !== 0) {
            console.log("onConnectionLost: " + responseObject.errorMessage);
            document.getElementById("status").innerText = "Lost connection due to: " + responseObject.errorMessage;
          }
        }

        // called when a message arrives. Note that the full topic name is aka "destinationName"
        function onMessageArrived(message) {
          document.getElementById("status").innerHTML = "";
          console.log("onMessageArrived: " + message.destinationName + " : " + message.payloadString);
          if (message.destinationName == "emon/emonpi/vrms") {
            // "+" converts string to numeric, which is then rounded by toFixed(), which returns a string!
            var vrms = (+message.payloadString).toFixed(2);
            // Google chart guage
            vrmsGaugeData.setValue(0, 1, +vrms);
            vrms_gauge.draw(vrmsGaugeData, vrmsOptions);
            // scrolling line chart.js
            if (vrmsChartData.data.labels.length === 20) {
                vrmsChartData.data.labels.shift();
                vrmsChartData.data.datasets[0].data.shift();
            }
            // we don't have the time in the mqtt message!
            var timestamp = new Date().toLocaleTimeString();
            vrmsChartData.data.labels.push(timestamp);
            vrmsChartData.data.datasets[0].data.push(vrms);
            lineChartVrms.update();
          } else if (message.destinationName == "emon/emonpi/power1") {
            var power1 = message.payloadString;
            // Google
            power1GaugeData.setValue(0, 1, +power1);
            power1_gauge.draw(power1GaugeData, power1Options);
          }
        }

        // ------------- Google Charts -----------
        var vrmsGaugeData = new google.visualization.arrayToDataTable([
            ['Label', 'Value'],
            ['Vrms', 240]
        ]);
        var power1GaugeData = google.visualization.arrayToDataTable([
            ['Label', 'Value'],
            ['Power', 0]
        ]);
        var vrmsOptions = {
            min        : 200,
            max        : 260,
            minorTicks : 5,
            greenFrom  : 230,
            greenTo    : 250,
            majorTicks : ['200', '210', '220', '230', '240', '250', '260']
        };
        var power1Options = {
            min        : 0,
            max        : 5000,
            minorTicks : 5,
            majorTicks : ['0', '1kW', '2kW', '3kW', '4kW', '5kW']
        };

        var vrms_gauge = new google.visualization.Gauge(document.getElementById('vrms-gauge'));
        var power1_gauge = new google.visualization.Gauge(document.getElementById('power1-gauge'));
        vrms_gauge.draw(vrmsGaugeData, vrmsOptions);
        power1_gauge.draw(power1GaugeData, power1Options);

        // chart.js
        var chartOptions = {
            responsive: true,
            tooltips: {
                mode: 'index',
                intersect: false,
            },
            hover: {
                mode: 'nearest',
                intersect: true
            },
            scales: {
                xAxes: {
                    display: true,
                    scaleLabel: {
                        display: true,
                        labelString: 'Time'
                    }
                },
                yAxes: {
                    display: true,
                    scaleLabel: {
                        display: true,
                        labelString: 'Value'
                    }
                }
            }
        };

        // this allows us to have common chart options, while varying the scale in each chart
        var vrmsChartOptions = structuredClone(chartOptions);
        // use sensible range, which will be expanded if the data goes outside "suggested"
        vrmsChartOptions.scales.yAxes.suggestedMin = 230;
        vrmsChartOptions.scales.yAxes.suggestedMax = 250;

        var vrmsChartData = {
        type : 'line',
        data : {
            labels: [],
            datasets : [{
            label : 'Vrms',
            backgroundColor : 'rgba(255, 136, 0, 0.5)',
            borderColor : 'rgba(255, 136, 0, 1.0)',
            fill: true,
            data : []
            }]
        },
        options : vrmsChartOptions
        };

        const lineChartVrms = new Chart('vrmsChart', vrmsChartData);
    }
</script>

<h1>EmonPi Live Feed</h1>
<div class="container">
    <div class="row">
        <div id="vrms-gauge" style="width: 120px; height: 120px;"></div>
        <div id="power1-gauge" style="width: 120px; height: 120px;"></div>
    </div>
    <div class="row" id="status">loading data...</div>
    <div class="col-10">
    <div class="card">
        <div class="card-body">
            <canvas id="vrmsChart"></canvas>
        </div>
    </div>
</div>
</div>
</body>
</html>

Don’t forget to change the IP address for the MQTT broker!

Serving the Dashboard

While the above HTML + JavaScript works fine as a file on your PC (so long as you have a network connection to acquire all those JavaScript libraries from), it can also be placed on the EmonPi.

I have opted to create a separate area from EmonCMS in the interest of avoiding too much risk of cock-up, future muddle, etc… The files in this separate area will all be “static” in the sense that they are just served to users as they are (no PHP etc). The dashboard page above IS static in this sense, since the JavaScript executes on your PC inside the web browser; all the EmonPi does is send it.

EmonCMS uses the Apache2 web server, so it is easy to make it listen on a different port (EmonCMS uses port 80, and I have chosen port 8001) using the following commands (in a SSH).

Create the place where the HTML file will live

cd /var/www
mkdir static

Check the directory ownership is correct using “ls -la”, which should show “drwxr-xr-x 2 pi pi 4096 Nov 27 23:02 static”.

If necessary “chown pi:pi static”.

Place the HTML + JavaScript file here (I suggest using the scp command, for example “scp dashboard.html pi@192.168.1.1:/var/www/static”).

Change the Apache2 config

There are two things to change, first to make apache2 listen on port 8001, and secondly to tell it to use the files in /var/www/static in connection with port 8001 requests.

cd /etc/apache2
sudo nano ports.conf

Add a single line “Listen 8001”, then save and exit.

For the second step, enter the “sites-enabled” directory. I chose to copy the existing emoncms.conf file, naming the copy “static.conf” and editing it to contain:

<VirtualHost *:8001>
  ServerName localhost
  ServerAdmin webmaster@localhost
  DocumentRoot /var/www/static

  # Virtual Host specific error log
  ErrorLog /var/log/static/apache2-error.log

  <Directory /var/www/static>
    Options FollowSymLinks Indexes
    AllowOverride All
    DirectoryIndex index.html
    Order allow,deny
    Allow from all
  </Directory>
</VirtualHost>

The changes are fairly obvious, but note that I have also added “Indexes” against “Options”. This makes apache give a listing of all the files in “static” when I use the URL “http://192.168.1.1:8001”. If you only have one dashboard, then simply name it “index.html” and it will appear when that URL is used.

Make a directory for logs

Otherwise apache2 will not restart.

cd /var/log
mkdir static

Restart Apache2

To load the new config.

sudo systemctl restart apache2

Make sure EmonCMS is still working, then visit your new site! It should work adequately on a mobile phone, once rotated to landscape format.
 

Review of CTC Tools – Don’t Buy from CTC Tools!

The prices look good but CTC tools is hopeless.

I ordered some tools and got a tracking code, with a shipping date of Nov 25th. The tracking said the local courier had not yet received the package. After several weeks I queried this and was told that the package had in fact been returned due to an inadequate address. They send a pdf of the package label. The address was correct. The courier (Hermes) must just have been lazy. OK this may not be CTC’s fault but their failure to inform me about the return IS.

They did give me a refund but had taken payment from paypal in USD, in spite of the website being priced in £ sterling, so the refund came out £6.66 short due to the exchange rate changing. They refused to make up the difference, citing a policy (who reads those) which said prices were given in sterling “as a service”.

So, six weeks after shipping, I have no tools and am £6.66 the poorer for it.

No doubt they will protest that none of this is their fault, but it is just cause for poor reputation; I could have spend a few pounds extra and received my tools in good time. I suggest you do the same!

Route Between Crowden Clough and Kinder Downfall

The lay of the land and the nature of the water channels probably makes this route over Kinder Scout easier to find when taken from Crowden Clough to Kinder Downfall. The path is generally visible but a compass is necessary equipment to avoid being misled in poor visibility. HOWEVER, the right of way marked on the OS map appears not to be the way people go, and an attempt to follow this route with a GPS is likely to be an unhappy experience (Google/Bing will reveal stories).

In case anyone should wish to follow a GPS track, or to compare an on-the-ground route with the OS map, here is my track log.

Crowden Clough to Kinder Downfall GPS track log (GPX format). This was (for me) a fairly obvious and reasonable route.

Bulk Upload of Historical Weather Data to Wundergound

A few months ago I bought a weather station but only lately registered with Wunderground and was slightly dismayed that the software I use (Cumulus, which is heaps better than what the station supplier included) does not post historical data; it only uploads to Wunderground what it downloads from the station when Cumulus starts up.

It seems there is no “off the shelf” way of doing this so here is a how-to-do it. The steps should be applicable to any weather station software that stores the data as a “CSV” or formatted text file, with a little bit of fiddling. I guess a similar process works for weather upload sites other than Wunderground too. The steps are:

  • get the stored data into a spreadsheet. This is easy for Cumulus since the data is stored in a text file with commas separating the values and the Cumulus help file tells you what each column is.
  • convert the units. I prefer SI units but Wunderground uses American conventions.
  • create a URL (web address), one for each data record to be uploaded. The structure for these is documented on the wunderground wiki. You can simply copy these into a web browser (Firefox, Internet Explorer etc) one by one but once you’ve had the satisfaction of seeing it work, the remaining thousands of records need a better method.
  • use wget to process a batch of URLs. Wget is free open source software. Windows users can find in installer here.

I’ve uploaded an example spreadsheet that does the conversion and creates the URLs. Notice it has three sheets and that the “Conversion Factors” also contains the base of the URL. This must be edited to have your station name and password. NB there is also a Celcius-Farenheit conversion and the peculiar column L on the “Converted” sheet is needed to get a correctly formatted URL from the date-time combination.

To use wget I copied the URLs into a “.txt” file, one URL per line (just drag down the entries in the column of the spreadsheet and copy/paste into an empty text file) and created a small “.bat” file containing:

PATH “C:\Program Files\GnuWin32\bin”
wget -v -o log.txt -O responses.txt -i “urls Apr12.txt”

You may need to alter the first line depending on where you installed wget. The second line assumes the list of URLs was saved to “urls Apr12.txt”. The “log.txt” file contains verbose logging of each “wget” and the “responses.txt” file should just contain a long string composed of one “sucess” for each sucessful posting of data. If it doesn’t, something went wrong…

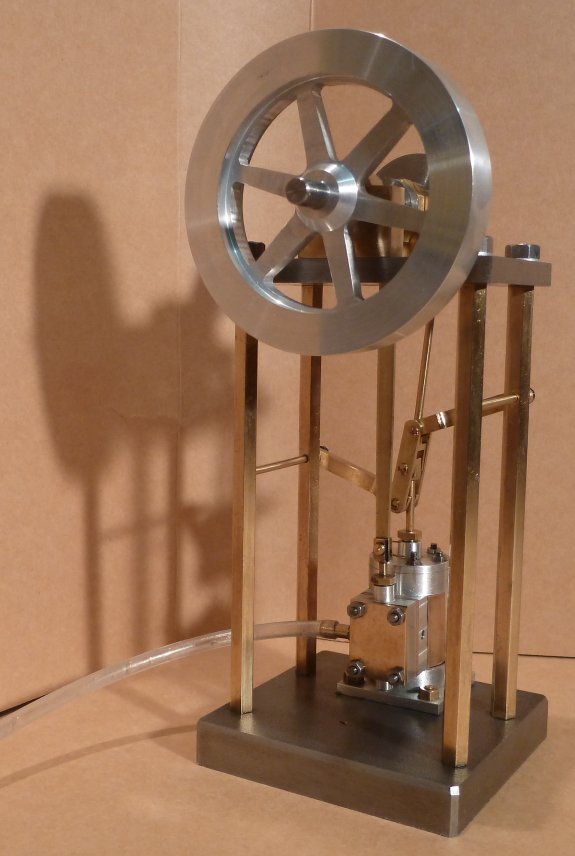
Making Elmer’s “Tall Vertical Open Column”

The late Elmer Verburg designed quite a few relatively-easy-to-build model engines. All are made from bar stock. The second one I have made is #32, the “Tall Vertical Open Column”. As many people do, I made a number of minor changes. These are described here, along with some construction notes I wrote to help myself, some observations and some pictures.

The plans can be found online in several places: there are several “Yahoo Groups” as well as “jon-tom.com“. I have also uploaded them (see “Files” section).

Notes and Comments

I opted not to paint the base and top platform, having previously made a mess of painting. Instead, I left them relatively “raw”: the as-rolled large faces of the bar stock were very lightly cleaned up and the edges were draw-filed. I’m fairly happy with this approach and like the contrast with the shiny flywheel and brass components.

In the interest of simplifying construction – and reducing the need for careful working, which is not my strong point – an alternative method of constructing the eccentric sheave and the arms that ensure a straight-line motion of the piston rod were used. See the “Files” section below.

The only problem encountered on assembly was that the straight-line that the arms followed did not match the piston rod. It is worth making the holes on the base plate of the cylinder assembly a bit slack to allow for adjustment but I ended up having to insert a 15 thou shim under one corner to get the motion to be “good and free”. I suspect that this is due to having used quite small AF hexagon rod for the columns such that it didn’t pull itself square on tightening. On the other hand, it could simply be a misplaced hole.

Quite a few of the joints leak slightly – see the video – since I just left them as metal-on-metal.

Some other examples on the web:

Files


Death of a Corsa (1.0 Twinport)

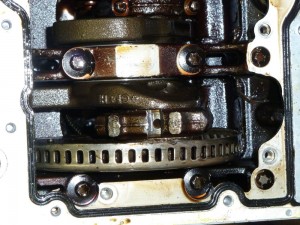
The sad remains of my Z10XEP engine.

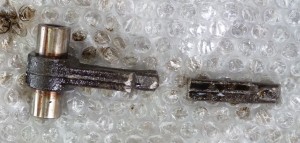
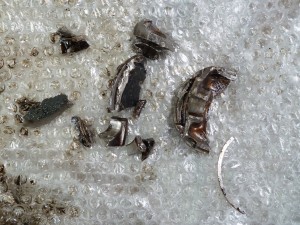
The piston rod fractured just next to the big end bearing with “intersting” consequences. It didn’t sound as bad as it looks; it sounded like there was just something like a branch caught under the car. Initial diagnostic scan was P0335 – CKP Sensor A Circuit Performance – because pieces of swarf and broken piston ring were stuck to the sensor (it is magnetic).

The Big End (showing its fracture)
The Piston Rod
The Remains of the Piston